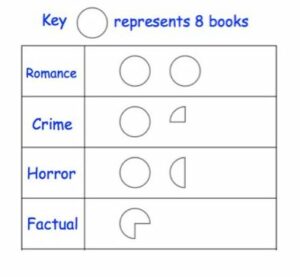
The graph shows the number of books sold.
1.How many romance books were sold? 16
2.How many more horror books were sold compared to crime books? 12 horror books, 10 crime books. 2 more horror books.
3.What type of book were least sold? Factual books
4.How many books were sold in total? 44
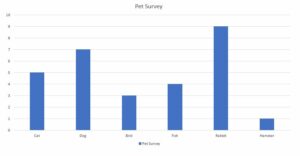
The graph shows people’s favourite pet.
1.What was the favourite type of pet? Rabbit
2.How many people’s favourite pet was a hamster? 1
3.How many more people preferred a dog than a cat? 5 people like cats, 7 people liked dogs. 2 more people preferred dogs to cats.
4.What was the total of the three favourite pets? 9 rabbits, 7 dogs, 5 cats = 21 pets
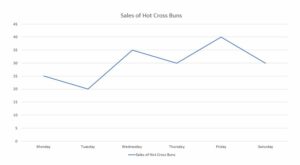
This line char shows the number of hot cross buns sold in a week.


© 2023 Tayside Regional Improvement Collaborative
Website by Internet Creation Ltd