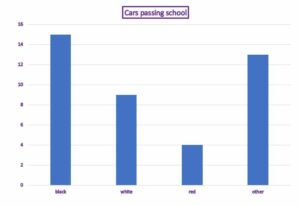
This graph shows the colours of cars passing by the school. Based on the information from the graph:
1.What colour of car is most likely to pass the school next?
2.How many more black cars passed the school than red cars?
Use the video to help you.


© 2023 Tayside Regional Improvement Collaborative
Website by Internet Creation Ltd