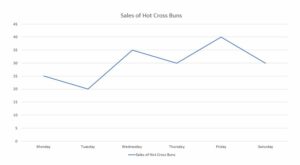
This line graph shows sales of hot cross buns.
- How many hot cross buns were sold on Monday?
- Did the number of hot cross buns sale increase or decrease between Tuesday and Wednesday?
- How many more hot cross buns were sold on Friday than Saturday?
- Which day had the fewest number of hot cross buns sold?

