Another way of organising data is to use a Tally Chart.
In a tally chart, One vertical line is made for each of the first four numbers; the fifth is represented by a diagonal line across the previous four.

The Tally chart below shows favourite toppings on pizzas.
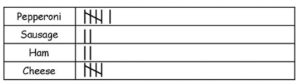
Can you work out...
Now watch the video explanation to see if you were right.


© 2023 Tayside Regional Improvement Collaborative
Website by Internet Creation Ltd